November 1981 began relatively quietly in the Salish Sea region. During the first two days of the month, a baroclinic band brought some precipitation to British Columbia’s South Coast and Northwest Washington. The moisture stream lifted northward on the 2nd, and then swept southeast to revisit the South Coast, Washington and Oregon as a quick-moving front on the 3rd. After this, surface high-pressure ridging built-in, and mainly dry conditions prevailed through the 7th. On the 8th, a weak system brought a little precipitation mainly to Vancouver Island, followed by another pause before a fast-moving and weakening front swept ashore on the 10th. Immediately on the heels of this impulse, a vigorous front associated with a low-pressure system that tracked near Haida Gwaii brought widespread precipitation to the region, including a narrow cold-frontal rain band that brought some heavy downpours to southwest Oregon. This front heralded a complete opening of the “storm door” and the development of a southwest flow pattern over the region that brought one of the most significant windstorms on record from the 13th to 14th.
The windstorm began in the northern Pacific on 12 Nov 1981 far offshore, a weak low tracking into the base of a broad upper-level trough centred near 140 to 135ºW near the left-exit region of a strong jet stream (Figures 1.2, 1.3 and 1.4), a classic setup for the development of strong lows that end up moving near and into the Cascadia region. Carried by a strong zonal flow, the weather system rapidly moved east-northeast, with the centre located near 36ºN as it crossed 150ºW late on 12 Nov, then gradually reaching 40ºN by the time it neared 130ºW late on 13 Nov 1981.

The extratropical cyclone, supported by a strong jet stream with speeds up to 80 m/s (290 km/h), rapidly deepened as it followed this track. Indeed, an analysis by Reed and Albright (1986) suggests that the central pressure fell at least 50 hPa (1.48″ Hg) in the 24-h ending 1800 UTC 13 Nov, among the highest on record. Given that the mean latitude of the low-pressure centre was 39ºN (range 36º to 42ºN) during this fast intensification period, this development ranks a whopping 2.9 Bergerons where 1.0 Bergeron equals 17.44 hPa/24-h for the given average latitude.

A value of 2.9 Bergerons is among the highest on record and may in fact be the most extreme–for storms that have brought high winds to the Cascadia/Salish Sea region in the modern surface airways record. It far exceeds the 1.9 Bergerons the recent and much discussed 21-22 Oct 2021 extratropical cyclone, and even the extreme 2.4 Bergerons of intensification exhibited by its phenomenally deep sister storm on 23-24 Oct 2021. Another recent extratropical cyclone that received attention for deepening rates tracked southeast into northern California on 25-26 Nov 2019. This one also ranked 2.4 Bergerons. Even the 2.0 Bergerons of the infamous 1962 Columbus Day Storm, deepening 35 hPa in 24-h along a mean latitude of approximately 39ºN on a similar track to the 1981 event, falls short.

The low-pressure centre of the 13-14 Nov 1981 followed a recurving track up the Pacific coast. This is known as the “classic path” (Figure 1.5). With the low moving northward very close to the coastline, damaging winds can occur across a large region from northern California into southern British Columbia. Thus, these storms tend to have the widest-reaching impacts. Extratropical cyclones with a more zonal–west to east–tracks tend to affect smaller areas with their strongest winds.

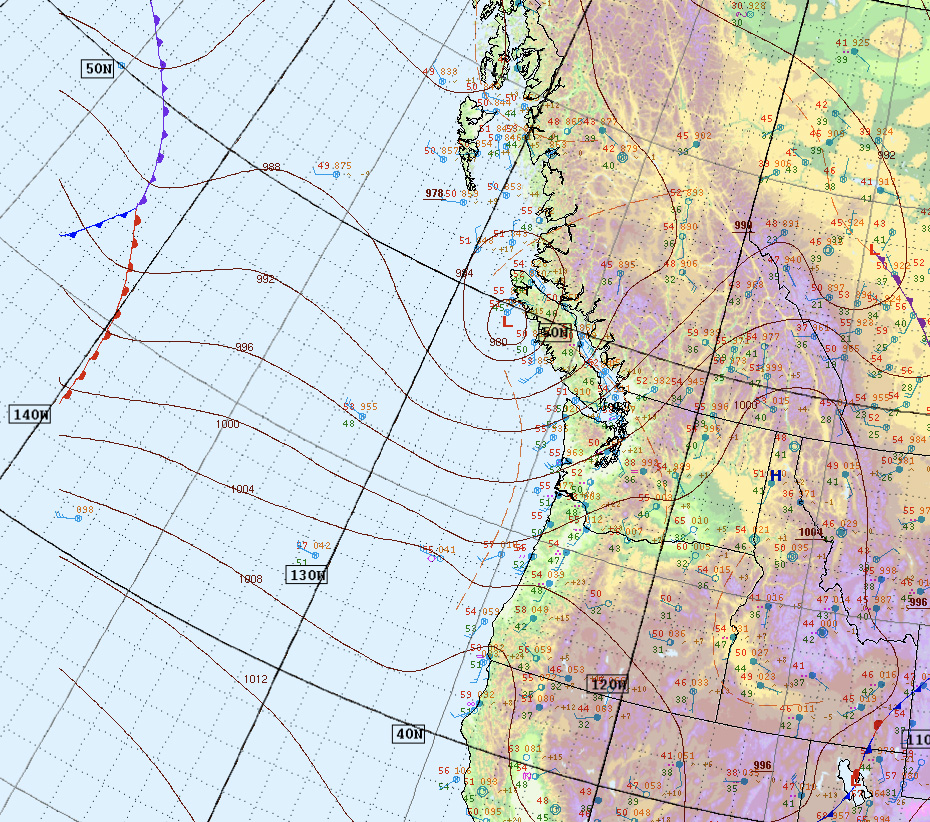
The major windstorm of ’81 reached peak intensity just off Northern California, and remained very strong as it headed north-northeast along the Pacific Coast (Figure 1.6). Due to striking the California/Oregon border region during Friday evening and night on 13 Nov, the system has been given the moniker “Friday-the-13th Storm”. A decent title for such a potent system, striking just two weeks after that spookiest of non-holidays. However, for the major population centres from about Salem northward, the maximum winds arrived on 14 Nov. It has been said that Saturday the 14th can be worse than Friday the 13th.

The Southwest Oregon coast received particularly intense winds from this storm. The ERA5 reanalysis data paints 120-160 km (75 to 100 mph) gusts throughout this region and extending into extreme northern California. This is supported by actual measurements (Figure 1.6). The peak gust of 148 km/h (92 mph) at Coos Bay, Oregon, is markedly higher than the 130 km/h (81 mph) measured during the 1962 Columbus Day Storm. Wind speeds approaching 150 km/h puts terrific stress on trees, causing widespread stem and root failures. Entire swaths can be flattened. The winds at the 850 height, about 1.25 km above sea-level during this event, are suggestive of near-surface gust potential. They reached 175 km/h (110 mph) right along the coastline near Cape Blanco late on the 13th and this fits well with the available observations.

The extratropical cyclone, now in a mature occluded state, gradually weakened as it tracked northward up the Oregon coast. One mark of this is the cloud field exhibiting a multiply-wound spiral as the occluded front wraps around the low-pressure centre (Figure 1.7). However, very intense storms can still deliver a damaging windstorm even as they are weakening.

The Friday-the-13th Storm still retained enough intensity to carry the most extreme winds–hurricane-force wind gusts of ≥120 km/h (75 mph)–all the way to Cape Disappointment in southwest Washington. In the early morning hours, just before 0400 PST in fact, strong southerly winds peaked nearly simultaneously across Oregon’s Willamette Valley. The highest gusts were associated with a vigorous leading occluded front that contained embedded thunderstorms. Decent vertical mixing associated with this boundary appears to have helped bring upper-level wind momentum to the surface, enhancing wind speeds.

Gusts of 114 km/h (71 mph) occurred both at Salem and Portland, the strongest for the former since the intense 02 Oct 1967 windstorm and the latter since an event on 25-26 Mar 1971, a classic-path extratropical cyclone like the Friday-the-13th Storm. Wind speeds at the 850 hPa height were 130 to 150 km/h (80 to 95 mph) over much of the Willamette Valley at this time–this potential was not fully realized at the surface at the official weather stations. However, unofficial reports indicated speeds up to 130-140 km/h (80 to 85 mph) at some locations. Exposed ridgetops even received higher values.
During the late morning and early afternoon, the strongest winds swept through the Salish Sea area (Figure 1.8). With the low continuing to degrade, wind speeds slowed a bit relative to what occurred in Oregon. Even the height 850 hPa winds backed off a tad, generally 125-140 km/h (75-85 mph) over the region. On the Washington Coast, gusts reached 113 km/h (70 mph) at Hoquiam–intense but far below reports from many near-shore locations in the Beaver State. Considering interior sites, Olympia reported a peak southerly (S) gust of 104 km/h (64 mph), strongest since the 1962 Columbus Day Storm. While wind speeds over the Puget Lowlands were generally lower than the reports from Oregon, a small region around the Seattle Area received comparable magnitude. A 107 km/h (67 mph) gust from the S occurred at the Sea-Tac Airport just after noon, highest since 28 Feb 1955. During classic-path storms, peak wind speeds at Sea-Tac are often markedly behind those at Portland–not so much with the Friday-the-13th storm, especially when reports from the nearby Renton Airport are considered. Here, southerly gust speeds reached a damaging 114 km/h (71 mph), strongest since 1962.

I lived in Renton at the time, and witnessed widespread destruction of trees. This includes seeing some topple during the heavy gusts–in a few cases all too closely! Damage included massive western hemlocks and Douglas-firs that either suffered stem failure or were uprooted, sometimes leaving divots over a meter deep in the ground. Black cottonwoods, red alders and bigleaf maples also experienced numerous failures. Some of these specimens then crashed into other trees, often severely damaging or even toppling the impacted specimen, a sort of arboreal dominoes. Many mature, healthy trees along a cutblock for a new subdivision–individuals that had not had the time to acclimate to heavy wind load after losing their sheltering neighbours–were either damaged or wind-thrown. At least fifty trees fell among the patchy woodlots along the transmission line corridor between Grant Avenue South and the Cedar River. The broken specimens slowly decomposed and became overgrown with new vegetation over the years, but remained an ever-present reminder of the big gale of November ’81. Outside of tree considerations, numerous shingles were stripped from rooftops, littering the ground, and plexiglass stairwell covers on some condominium buildings were punched-out.
Coastal British Columbia is known as the extratropical cyclone graveyard, and for good reason. Many decaying storms land on the coast and then rapidly fall apart upon interaction with the steep and rugged terrain. The Friday-the-13th storm was no exception (Figure 1.9). As the low tracked across southern Vancouver Island, its central pressure shot up to 981 hPa (28.97″ Hg) by 1300 PST. When the low tracked into the mainland Coast Ranges, the low filled even further, increasing by another 5 hPa by 1600.

For the major population centres on British Columbia’s South Coast, classic-path windstorms are hit-and-miss in terms of generating high winds. Relative to regions to the south, these extratropical cyclones are often at a markedly weakened state by the time they reach Vancouver Island. This limits wind speed potential, though not always. For example, the 1962 Columbus Day Storm (AKA “Typhoon Freda”) while definitely in a weakening state as it landed on the tip of the Olympic Peninsula still delivered the most severe windstorm to the region on record, with wind gusts of 125 to 145 km/h (75 to 90 mph) causing widespread destruction, including the biggest loss of BC Hydro electrical service in terms of percent of total customers affected (~67%).
High winds from the Friday-the-13th Storm just clipped the extreme southern sections of the South Coast. This includes a 114 km/h (71 mph) gust at Victoria’s Gonzales Heights–a well exposed location known for relatively high wind readings. Abbotsford reported a SSE gust of 102 km/h (63 mph), strongest since 10 Dec 1970. Both the Victoria and Vancouver International Airports received gusts below high-wind criteria, SW 72 km/h (45 mph) and SE 85 km/h (53 mph) respectively. Height 850 hPa winds ranged from 90-120 km/h (55-75 mph), much lower than places south and another reflection of the waning storm.
As the Friday-the-13th storm faded from history, a second intense extratropical cyclone developed on its heels (Figure 1.10). This weather system also brought high winds to parts of the Pacific Coast, though overall the speeds were markedly less than with the initial storm. Had the Friday-the-13th storm not occurred, this event would have been the most significant windstorm of the 1981-82 season at many locations. Further examination of this event is a story for another time.

Pressure gradients–horizontal differences in air pressure–drive the wind. The stronger the gradient, the greater the potential for stronger winds. Peak gradients offer another means aside from wind speed for assessing the strength of a windstorm. For northwest Oregon and southwest Washington, the Friday-the-13th storm produced some intense values (Figure 1.11).

To put the pressure gradient numbers in context, 4.0 to 5.0 hPa/100 km can support strong winds on the order of 50 km/h G 75 (30 mph G 45). Magnitudes of 6.0 to 7.0 hPa/100 km occur infrequently, especially inland, and can support winds of 65 km/h G 90 (40 mph G 55). Storms that produce 8.0 to 9.0 hPa/100 km are very rare and can support winds of 75 km/h G 105 (45 mph G 65), even higher. Gradients ≥10.0 hPa/100 km are extremely rare, especially inland, and can support winds of 80 km/h G 115 (50 mph G 70), sometimes much stronger. This information puts the 1981 Friday-the-13th Storm into context–just after peak intensity, the extratropical cyclone still yielded gradients in the range of 8.9 to 11.3 hPa/100 km, certainly strong enough to support the observed wind speeds. It is unfortunate that the weather reporting at key weather stations in northwest California, namely Crescent City, was very spotty, preventing computation of peak gradients nearer to the storm when it was at peak intensity–the numbers may have been higher than places to the north.
Peak gradients for the 1962 Columbus Day storm–the baseline windstorm that all others are often compared to–are included for comparison. Many locations had markedly higher gradients during this catastrophic windstorm. The key exception is the southwest Washington interior–given the close proximity of Tacoma McChord Airforce Base to the airport at Olympia, the top two legs of the this pressure-wind triangle, noise in any of the pressure reports from the two stations can lead to significant error. Thus confidence in the numbers is not as high as with other locations. The difference in pressure gradient magnitude far to the north in British Columbia is quite large and readily explains the difference in wind outcomes between the two storms. Indeed, the value of 11.7 hPa/100 km is the highest on record for this pressure-wind triangle–by far–going back to 1953. The southwest Washington Coast value of 15.5 hPa/100 km is extremely high, but interestingly is not the record. That is held by the compact and very intense 03 Nov 1958 extratropical cyclone: 19.8 hPa/100 km, one of the most extreme pressure gradients on record for the Pacific coast from Ukiah, California to Cape Scott on the north tip of Vancouver Island.
Some additional analysis will be added over the next week or so.
Further details on this and many of the storms mentioned here can be found on the Storm King website hosted by the Office of the Washington State Climatologist.
40 Years Ago: The Major 13-14 November 1981 Windstorm
Began: 06 Nov 2021
Modified: 13 Nov 2021